
...and it's easier to do if you are a woman in a crisis-hit Mediterranean country.
OK, it’s quiz time. Which of the following statements are true?
- Life expectancy in Mexico is higher than in Washington DC.
- Life expectancy in Shanghai is higher than in Sweden.
- Life expectancy in Hungary is lower than in Beijing, but about the same as in Mississippi state.
- Even the worst Eurozone country has a higher life expectancy than the US average.
- Bosnia-Herzegovina has a higher life expectancy than Denmark.
- Georgia, the country, has the same life expectancy as Georgia, the US state.
If we believe our sources (see at the end), all of these statement are true, which is amazing. See the full ranking below for more interesting tidbits for pub table conversations. Of course some caveats are in order – statistics can be unreliable or manipulated in some countries.

photo: Judit Babidorics
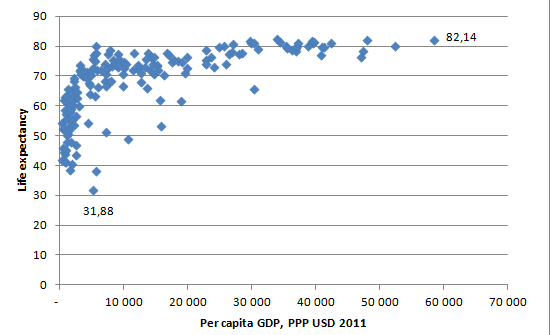
Life expectancy is the statistical average age when people in a certain group (e.g. country or region) die. The current global average is around 67 years. Life expectancy also changes over time. Life expectancy varies a great deal even within countries, and at first sight it is not obvious why. Wealth has something to do with it: within one country typically (but not always) people in the richer regions tend to live longer – Shanghai is top within China both in terms of per capita income and life expectancy. It certainly helps to be a rich city-state – women in Monaco can expect to live around 94 years. Also, the shortest lived end of the list below is mainly comprised of poor countries, predominantly in Africa.
Source: IMF, CIA
But once you get above a certain income level, and compare across countries, the connection becomes extremely loose (see chart above) – that is the main source of the surprising statements above. The US is an interesting example: it is the richest large country, yet on average, life expectancy is not especially high. That is how Portugal, with the lowest life expectancy among the Eurozone countries, and with GDP per capita of about half of the US level, still manages to outlive the average American. The US is the 51st country in terms of life expectancy (78.4 years) among the countries and territories listed by the CIA. Is it the lack of universal health care? Or large income differences? Or unhealthy diet/obesity? It is difficult to be certain, as many of the effects are interconnected. As a country gets richer, usually life expectancy increases, but so do healthcare spending; on the other hand, life may become more stressful. So the way of causality is extremely hard to disentangle. And to complicate the matters, because of the generally increasing life expectancies, the current life expectancy probably tells little about what the expected lifespan of a newborn today might be – don’t forget that life expectancy calculations give you a life expectancy of a newborn today assuming that mortality rates remain unchanged.
It also helps if you live in relatively warm (or is it sunny?) regions/countries. Within the US, Hawaii is first in terms of life expectancy, despite not being among the richest states, and Puerto Rico does better than average, despite being the poorest.

Photo: Judit Babidorics
On the following map of regional life expectancy within the EU, it is clear that there is a North-South divide in favor of the South (apart from the more intuitive East-West one). The dividing line can even run within countries – look at France. Bosnia is not shown, but to some extent it fits this “Southern” pattern, as does relatively long-lived but poor Albanians (living longer than Czechs for example).
At the other extreme, in some parts of Siberia and also, more surprisingly, deprived parts of Scotland , male life expectancy is around 50 years, comparable with very poor, AIDS ravaged African countries. Again, it is difficult to disentangle the effect of smoking and alcoholism from that of climate, and they are possibly related. Within Russia, life expectancy is highest in poor but southern Caucasian regions like Ingushetia and Dagestan. Of course it helps that these tend to be Muslim and tend to drink less vodka, so again it is not purely climate we are talking about…

Again, a lot of theories have been proposed to explain why people in warmer climes live longer. These range from better availability of fresh vegetables to olive oil use to red wine drinking, or just the more relaxed lifestyle and more outdoor activity and more vitamin D metabolism in sunnier places. It is probably a mix of things, but the jury is still out…
So what is the best tip based on the above? Try to become a rich woman, and move to Hawaii. Or to the Mediterranean… but wait, the Southern EU countries are going to be in economic trouble, surely their life expectancy will suffer? Don’t bet on it. Life expectancy went up by a whopping 6 years during the Great Depression in the US. Why? There are also many alternative reasons put forward: in a recession, people have less money to spend on alcohol and cigarettes, a slowdown brings down pollution, less work means less stress (of course for those who do not lose their jobs), just to name a few. The mysteries of life expectancy are plenty…
Life expectancy in years for countries and sub-regions in Brazil, China, India and the US
|
|
89.73 |
|
|
84.41 |
|
|
83.01 |
|
Shanghai |
82.51 |
|
|
82.43 |
|
|
82.25 |
|
|
82.16 |
|
|
82.14 |
|
|
82.04 |
|
|
81.81 |
|
|
81.77 |
|
Hawaii |
81.5 |
|
|
81.5 |
|
|
81.38 |
|
|
81.38 |
|
|
81.17 |
|
|
81.07 |
|
|
81.07 |
|
|
80.96 |
|
Minnesota |
80.9 |
|
|
80.9 |
|
|
80.87 |
|
|
80.71 |
|
|
80.68 |
|
|
80.64 |
|
|
80.59 |
|
California |
80.4 |
|
New York |
80.4 |
|
|
80.31 |
|
Connecticut |
80.2 |
|
|
80.2 |
|
|
80.19 |
|
Massachusetts |
80.1 |
|
North Dakota |
80.1 |
|
Utah |
80.1 |
|
Germany |
80.07 |
|
United Kingdom |
80.05 |
|
Jordan |
80.05 |
|
Greece |
79.92 |
|
Colorado |
79.9 |
|
Arizona |
79.9 |
|
South Dakota |
79.9 |
|
Saint Pierre and Miquelon |
79.87 |
|
Austria |
79.78 |
|
Faroe Islands |
79.72 |
|
Malta |
79.72 |
|
New Hampshire |
79.7 |
|
Vermont |
79.7 |
|
Florida |
79.7 |
|
Iowa |
79.7 |
|
New Jersey |
79.7 |
|
Washington |
79.7 |
|
Netherlands |
79.68 |
|
Luxembourg |
79.61 |
|
Belgium |
79.51 |
|
U.S. Virgin Islands |
79.33 |
|
Wisconsin |
79.3 |
|
Rhode Island |
79.3 |
|
Finland |
79.27 |
|
Idaho |
79.2 |
|
Nebraska |
79.2 |
|
Taiwan |
79.18 |
|
Turks and Caicos Islands |
79.11 |
|
South Korea |
79.05 |
|
Oregon |
79 |
|
Wallis and Futuna |
78.98 |
|
Puerto Rico ( US) |
78.92 |
|
European Union |
78.82 |
|
Bosnia and Herzegovina |
78.81 |
|
Illinois |
78.8 |
|
Saint Helena, Ascension and Tristan da Cunha |
78.76 |
|
Maine |
78.7 |
|
Gibraltar |
78.68 |
|
Denmark |
78.63 |
|
Portugal |
78.54 |
|
Virginia |
78.5 |
|
Kansas |
78.4 |
|
Montana |
78.4 |
|
United States |
78.37 |
|
Republic of China (Taiwan) |
78.32 |
|
Delaware |
78.3 |
|
Alaska |
78.3 |
|
Texas |
78.3 |
|
New Mexico |
78.2 |
|
Pennsylvania |
78.2 |
|
Bahrain |
78.15 |
|
Maryland |
78.1 |
|
Michigan |
77.9 |
|
Cyprus |
77.82 |
|
Panama |
77.79 |
|
Costa Rica |
77.72 |
|
Indiana |
77.7 |
|
Chile |
77.7 |
|
Cuba |
77.7 |
|
Libya |
77.65 |
|
British Virgin Islands |
77.63 |
|
Wyoming |
77.6 |
|
Nevada |
77.6 |
|
Ohio |
77.5 |
|
Albania |
77.41 |
|
Missouri |
77.4 |
|
Dominican Republic |
77.31 |
|
Slovenia |
77.3 |
|
North Carolina |
77.2 |
|
Czech Republic |
77.19 |
|
Georgia |
77.12 |
|
Georgia |
77.1 |
|
French Polynesia ( France) |
77.1 |
|
Kuwait |
77.09 |
|
Northern Mariana Islands (US) |
77.08 |
|
Argentina |
76.95 |
|
Saint Lucia |
76.84 |
|
New Caledonia (France) |
76.75 |
|
Netherlands Antilles (Netherlands) |
76.65 |
|
South Carolina |
76.6 |
|
United Arab Emirates |
76.51 |
|
Mexico |
76.47 |
|
Uruguay |
76.35 |
|
Saudi Arabia |
76.3 |
|
Poland |
76.28 |
|
Tennessee |
76.2 |
|
Kentucky |
76.2 |
|
Arkansas |
76.1 |
|
Beijing |
76.1 |
|
Distrito Federal |
75.8 |
|
Santa Catarina |
75.8 |
|
Tunisia |
75.78 |
|
Paraguay |
75.77 |
|
Brunei |
75.74 |
|
District of Columbia |
75.6 |
|
Oklahoma |
75.6 |
|
Dominica |
75.55 |
|
Rio Grande do Sul |
75.5 |
|
Louisiana |
75.4 |
|
Slovakia |
75.4 |
|
Croatia |
75.35 |
|
Qatar |
75.35 |
|
Ecuador |
75.3 |
|
Aruba ( Netherlands) |
75.28 |
|
Alabama |
75.2 |
|
West Virginia |
75.2 |
|
Sri Lanka |
75.14 |
|
Minas Gerais |
75.1 |
|
Tianjin |
74.91 |
|
Lithuania |
74.9 |
|
Mississippi |
74.8 |
|
São Paulo |
74.8 |
|
Hungary |
74.79 |
|
Antigua and Barbuda |
74.76 |
|
Zhejiang |
74.7 |
|
Paraná |
74.7 |
|
Macedonia |
74.68 |
|
West Bank |
74.54 |
|
Mato Grosso do Sul |
74.3 |
|
Espírito Santo |
74.3 |
|
Cook Islands |
74.22 |
|
Oman |
74.16 |
|
Algeria |
74.02 |
|
Mauritius |
74 |
|
Kerala |
74 |
|
Maldives |
73.97 |
|
Barbados |
73.94 |
|
Shandong |
73.92 |
|
Jiangsu |
73.91 |
|
Serbia |
73.9 |
|
Goiás |
73.9 |
|
Suriname |
73.73 |
|
American Samoa ( US) |
73.72 |
|
Mato Grosso |
73.7 |
|
Rio de Janeiro |
73.7 |
|
Solomon Islands |
73.69 |
|
Lebanon |
73.66 |
|
Saint Vincent and the Grenadines |
73.65 |
|
Venezuela |
73.61 |
|
Jamaica |
73.53 |
|
People's Republic of China |
73.47 |
|
Gaza Strip |
73.42 |
|
Liaoning |
73.34 |
|
Malaysia |
73.29 |
|
Guangdong |
73.27 |
|
Saint Kitts and Nevis |
73.2 |
|
Thailand |
73.1 |
|
Jilin |
73.1 |
|
Bulgaria |
73.09 |
|
Seychelles |
73.02 |
|
Hainan |
72.92 |
|
Estonia |
72.82 |
|
Colombia |
72.81 |
|
Montserrat |
72.76 |
|
Armenia |
72.68 |
|
Bahia |
72.6 |
|
Fujian |
72.55 |
|
Hebei |
72.54 |
|
Pará |
72.5 |
|
Romania |
72.45 |
|
Heilongjiang |
72.37 |
|
El Salvador |
72.33 |
|
Amazonas |
72.2 |
|
Latvia |
72.15 |
|
Egypt |
72.12 |
|
Acre |
72 |
|
Brazil |
71.99 |
|
Turkey |
71.96 |
|
Uzbekistan |
71.96 |
|
Tocantins |
71.9 |
|
Samoa |
71.86 |
|
Anhui |
71.85 |
|
Morocco |
71.8 |
|
Rondônia |
71.8 |
|
Chongqing |
71.73 |
|
Shanxi |
71.65 |
|
Cape Verde |
71.61 |
|
Sergipe |
71.6 |
|
Vietnam |
71.58 |
|
Henan |
71.54 |
|
Nicaragua |
71.5 |
|
Guangxi |
71.29 |
|
Palau |
71.22 |
|
Sichuan |
71.2 |
|
Marshall Islands |
71.19 |
|
Syria |
71.19 |
|
Iran |
71.14 |
|
Rio Grande do Norte |
71.1 |
|
Philippines |
71.09 |
|
Hubei |
71.08 |
|
Amapá |
71 |
|
Ceará |
71 |
|
Federated States of Micronesia |
70.94 |
|
Trinidad and Tobago |
70.86 |
|
Moldova |
70.8 |
|
Indonesia |
70.76 |
|
Peru |
70.74 |
|
Fiji |
70.73 |
|
Tonga |
70.73 |
|
Hunan |
70.66 |
|
Belarus |
70.63 |
|
Roraima |
70.6 |
|
Russia |
70.3 |
|
Guatemala |
70.29 |
|
Ningxia |
70.17 |
|
Greenland ( Denmark) |
70.07 |
|
Shaanxi |
70.07 |
|
Iraq |
69.94 |
|
India |
69.89 |
|
Inner Mongolia |
69.87 |
|
Paraíba |
69.8 |
|
Piauí |
69.7 |
|
Kyrgyzstan |
69.43 |
|
Honduras |
69.4 |
|
Punjab |
69.4 |
|
Tuvalu |
69.29 |
|
Pernambuco |
69.1 |
|
Jiangxi |
68.95 |
|
Maranhão |
68.4 |
|
São Tomé and Príncipe |
68.32 |
|
Ukraine |
68.25 |
|
Belize |
68.2 |
|
Kazakhstan |
67.87 |
|
Turkmenistan |
67.87 |
|
Mongolia |
67.65 |
|
Alagoas |
67.6 |
|
Gansu |
67.47 |
|
Xinjiang |
67.41 |
|
East Timor |
67.27 |
|
Maharashtra |
67.2 |
|
Himachal Pradesh |
67 |
|
Bolivia |
66.89 |
|
Guyana |
66.68 |
|
Azerbaijan |
66.66 |
|
World |
66.57 |
|
Papua New Guinea |
66.34 |
|
Haryana |
66.2 |
|
Tamil Nadu |
66.2 |
|
Bhutan |
66.13 |
|
Qinghai |
66.03 |
|
Guizhou |
65.96 |
|
Grenada |
65.95 |
|
The Bahamas |
65.78 |
|
65.49 |
|
|
Nepal |
65.46 |
|
Tajikistan |
65.33 |
|
Karnataka |
65.3 |
|
West Bengal |
64.9 |
|
Pakistan |
64.49 |
|
Andhra Pradesh |
64.4 |
|
Tibet |
64.37 |
|
Nauru |
64.2 |
|
Gujarat |
64.1 |
|
Vanuatu |
63.98 |
|
North Korea |
63.81 |
|
India |
63.5 |
|
Comoros |
63.47 |
|
Burma |
63.39 |
|
Yemen |
63.27 |
|
Kiribati |
63.22 |
|
Mayotte ( France) |
62.91 |
|
Madagascar |
62.89 |
|
Sudan |
62.57 |
|
Cambodia |
62.1 |
|
Rajasthan |
62 |
|
Botswana |
61.85 |
|
Eritrea |
61.78 |
|
Equatorial Guinea |
61.61 |
|
Bihar |
61.6 |
|
Haiti |
60.78 |
|
Mauritania |
60.37 |
|
Bangladesh |
60.25 |
|
Uttar Pradesh |
60 |
|
Uttarakhand |
60 |
|
Ghana |
59.85 |
|
Orissa |
59.6 |
|
Benin |
59 |
|
Senegal |
59 |
|
Assam |
58.9 |
|
Togo |
58.69 |
|
Chhatisgarh |
58 |
|
Jharkhand |
58 |
|
Madhya Pradesh |
58 |
|
Kenya |
57.86 |
|
Guinea |
57.09 |
|
Laos |
56.68 |
|
Côte d'Ivoire |
55.45 |
|
Ethiopia |
55.41 |
|
The Gambia |
55.35 |
|
Democratic Republic of the Congo |
54.36 |
|
Western Sahara |
54.32 |
|
Republic of the Congo |
54.15 |
|
Cameroon |
53.69 |
|
Gabon |
53.11 |
|
Burkina Faso |
52.95 |
|
Uganda |
52.72 |
|
Niger |
52.6 |
|
Burundi |
52.09 |
|
Tanzania |
52.01 |
|
Namibia |
51.24 |
|
Rwanda |
50.52 |
|
Mali |
50.35 |
|
Somalia |
49.63 |
|
South Africa |
48.98 |
|
Guinea-Bissau |
47.9 |
|
Chad |
47.7 |
|
Nigeria |
46.94 |
|
Zimbabwe |
45.77 |
|
Afghanistan |
45.02 |
|
Central African Republic |
44.47 |
|
Malawi |
43.82 |
|
Djibouti |
43.37 |
|
Liberia |
41.84 |
|
Sierra Leone |
41.24 |
|
Mozambique |
41.18 |
|
Lesotho |
40.38 |
|
Zambia |
38.63 |
|
Angola |
38.2 |
|
Swaziland |
31.88 |
Sources: For countries: CIA World Factbook (2011 Est.)
For US states: http://www.worldlifeexpectancy.com/usa/life-expectancy for US states
For India: UNDP Human Development Report for India
For China, National Bureau of Statistics (via Wikipedia), http://shanghaiist.com/2012/02/20/shanghais_life_expectancy.php for latest Shanghai data
Data for Russian regions is also available here (http://www.undp.ru/2EF572DF-FD67-4766-A208-81DC58560B26/FinalDownload/DownloadId-E7CE38434968B306208F4A8DE24AFB55/2EF572DF-FD67-4766-A208-81DC58560B26/nhdr2010/National_Human_Development_Report_in_the_RF_2010_ENG.pdf), but it would have made the already long list even longer
Brazil is a 2007 estimate, China is a 2000 estimate (for Shanghai 2011), India is 2007, US is 2010-11
Ajánlott bejegyzések:


A bejegyzés trackback címe:
Kommentek:
A hozzászólások a vonatkozó jogszabályok értelmében felhasználói tartalomnak minősülnek, értük a szolgáltatás technikai üzemeltetője semmilyen felelősséget nem vállal, azokat nem ellenőrzi. Kifogás esetén forduljon a blog szerkesztőjéhez. Részletek a Felhasználási feltételekben és az adatvédelmi tájékoztatóban.
