
How high would oil prices climb if there was a fallout in Syria's or Egypt's production? Or if the crisis escalated and Iran, for example, stopped producing? Or if it blocked the Strait of Hormuz? In our interactive chart you can play around with your assumed oil supply shocks, too.
As we have argued before, in the longer run, oil supply is improving, due to unconventional oil. But the short run is all about supply disruptions and their potential price effects. The Syrian events have pushed up oil prices... Or was it really just the Syrian events? After all, Syria's oil production is minuscule (only 0.2% of global supply last year, but recently even below that).
As you might have already read elsewhere, recent glitches in Libyan production, for example, have had an order of magnitude larger effect on actual global supply than the whole Syrian production (see our favorite, Econbrowser's analysis here, or Wonkblog for another good take).
Of course if the Syrian turmoil spreads to neighboring countries, as some fear, or another conflict pops up elsewhere, that could lead to a very different situation. Iran or Iraq's production is already quite big compared to the global supply (each is over 3%), and oil demand is rather inflexible: a relatively low percentage decline in supply can lead to a big jump in prices. How big? Of course it is pretty hard to tell.
And, to complicate things, a disruption does not necessarily have to materialize to affect prices. Oil prices also include a risk-premium element that calculates with a large disruption at a certain probability level. This is already reflected in current prices, too.
Historically, a 1% output disruption in global oil production resulted in a roughly 10% increase in prices (see chart below). We and others use this rule-of-thumb quite often when we think of the short-term effects of supply shocks (or if you will, the short-run price elasticity of oil demand). (Of course the effect of shocks is partially mitigated by a production increase of countries with spare capacities - Saudi Arabia, in particular. Without that the price jump would probably be even larger.)
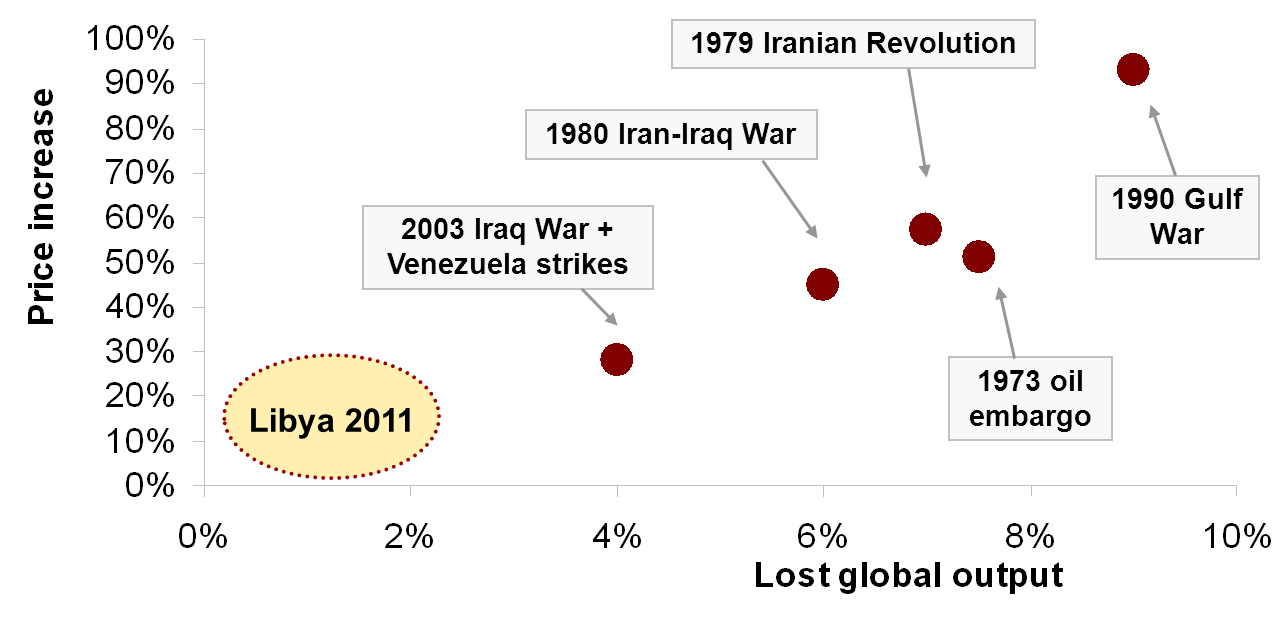 Historical shocks and price effects. Data source: Hamilton (2011)
Below I also charted what this rule-of-thumb would mean if certain countries' production fell to zero. Syria's production is so tiny that a complete shutdown there (in itself) would only mean a 2 USD/bbl increase. (Here we compare to a somewhat arbitrary 100 USD/bbl baseline - the current price already includes some supply shocks, particularly the drop in Libya's supply.)
If, however, Iran stopped producing, that would lead to prices over 130 USD/bbl. And this is still peanuts compared to a hypothetical scenario where the Strait of Hormuz was shut down (where 17 million barrels flow through each day). That would - in theory - mean prices of close to 300 USD/bbl. Of course then probably markets would cease to function and governments would step in to allocate oil (how inefficient that allocation would be is another question).
If you want to play around with your assumed oil shocks (combined percent fallouts in these countries), you can also do that in the chart below. Here you can change the disruption percentages marked in yellow. These could either mean a percent decline in production or a percent chance of a total shutdown. The sky is the limit.
(The only caveat is that the chart below is a bit too interactive in the sense that more users might alter the inputs at the same time... If you want to play on your own, you can do it here, but then you will need to log in with your Google account.).
Ajánlott bejegyzések:


A bejegyzés trackback címe:
Kommentek:
A hozzászólások a vonatkozó jogszabályok értelmében felhasználói tartalomnak minősülnek, értük a szolgáltatás technikai üzemeltetője semmilyen felelősséget nem vállal, azokat nem ellenőrzi. Kifogás esetén forduljon a blog szerkesztőjéhez. Részletek a Felhasználási feltételekben és az adatvédelmi tájékoztatóban.
